
DA Toolkit
Analyze your process data
The DA Toolkit is a software application that manages the process database from reports created by The Mickabooh Controller. It runs independently of The Mickabooh Controller and provides a rich set of post-processing analysis tools. It has a comprehensive search and analysis capability for your process data. With it, you will be able to create and save queries. In addition, you can create comparisons, averages, totals, and charts to fully understand your process data.
Moreover, the DA Toolkit can be used to monitor process quality by searching for any anomalies that can be seen on the charts. If there is a problem in your process, fluctuations can be seen and corrected before quality becomes adversely affected. The toolkit also automatically handles process and system data files backups in the controller in order to keep all files protected.


Data Analysis Features
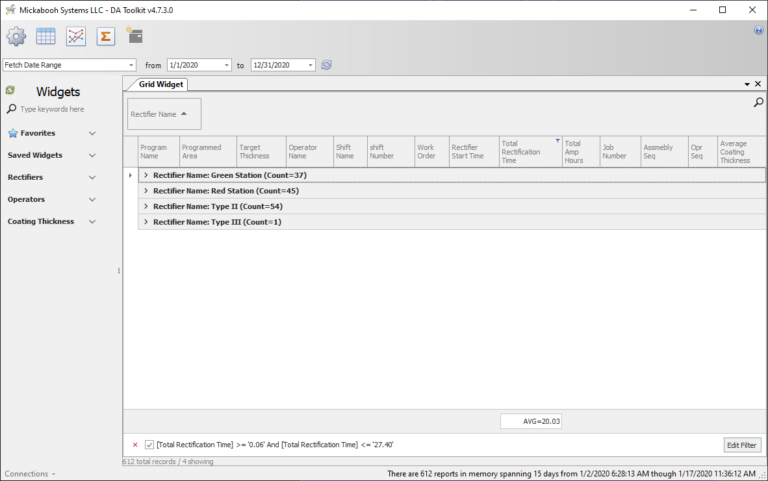
- Query: Is a comprehensive search capability of finding specific reports from the database. With the constraint tool, you can create queries to find reports based on the constraint you searched for.
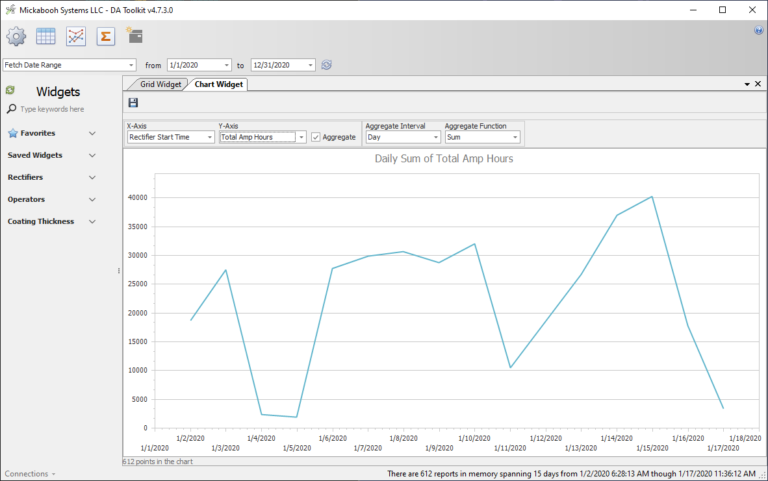
- Charts: Create charts to graphically display data fields by choosing the X and Y variables. It is a tool for visually depicting the data points to see consistency in numbers. Most importantly, the chart is a tool to see if there is any fluctuations that needs to be corrected before quality becomes adversely affected
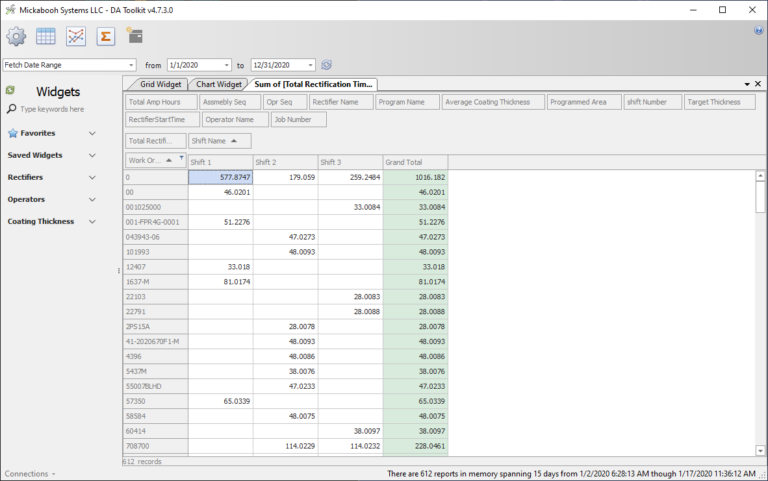
- Analytics: Comprehensive analysis capability to analyze your process data. Can analyze averages, totals, or efficiencies with specific time frames of daily, weekly, or monthly dates. Efficiencies is a visual representation on current progress compared to future trends on work efficiency. More in detail, gives you a chart displaying how much you are currently running versus how much you could be running.
- Overlays: Multiple charts on top of each other showing voltage, current, and temperature. With the overlay option, you can spot any inconsistencies in the runs.
